(Sorry I couldn’t resist the pun “graphic”…)
I wanted to show and explain a few graphs. I will also show some statistics and critique what they show and don’t show. I will limit my discussions mostly to those in Colorado as most of the charts are based on Colorado information only. Later ones in the post pertain to trends in other states.
Overall COVID-19 testing results with hospitalizations and deaths in Colorado
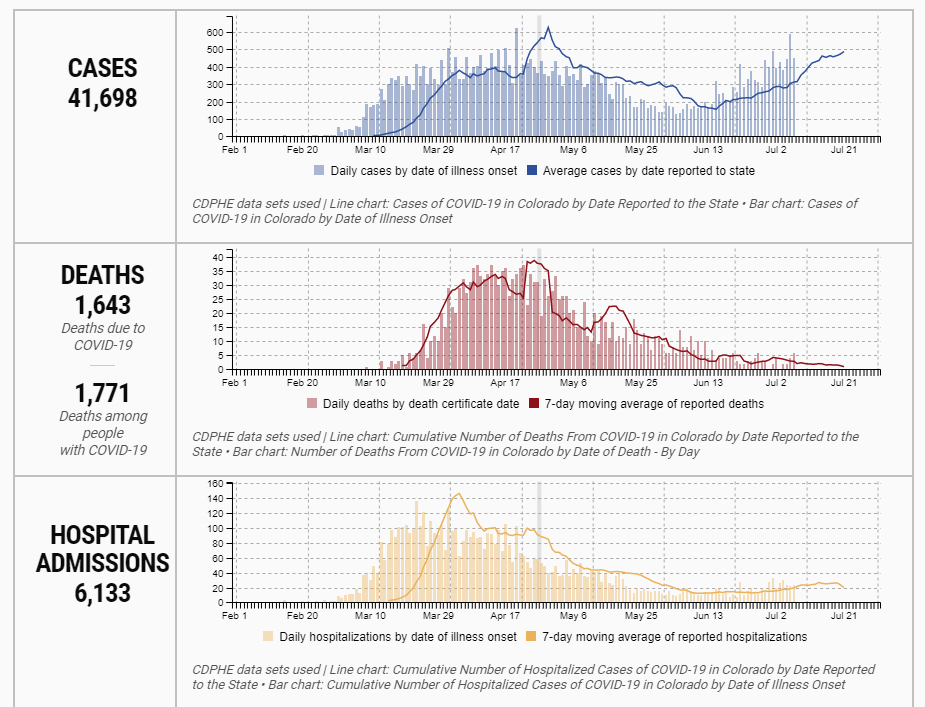
What one sees from this chart is that cases of new COVID-19 positive testing is going up. Interestingly the rate of hospital admission and deaths are going down.
What is one to make of this information?
The interpretation is that most people getting COVID-19 do not need hospitalization nor do they die from this condition.
Further interpretation (based on epidemiological information) is that most people testing positive are younger individuals less likely to need hospitalization and less likely to die from this illness. This analysis is not surprising from other information previously made known elsewhere from the CDC.
So let’s look at what happens in different age groups
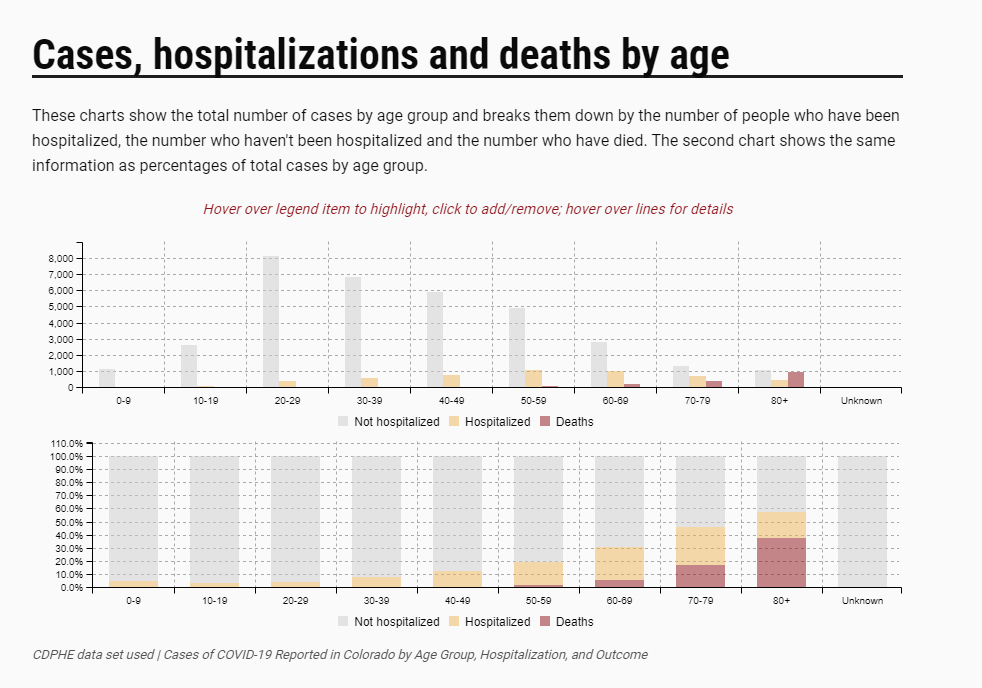
This graph shows the percentage of people hospitalized and who die from Covid-19.
Those in their 50’s appear to have a 20% risk of needing to be hospitalized but a less than 5% chance of dying. However those over the age of 50 show a steadily increasing risk of needing hospitalization and dying from this illness.
Progressing up the chart shows that those in their 80’s need to be hospitalized almost 80% of the time and over 60% of those hospitalized die.
At the other end of the chart, those under the age of 50, show a very low mortality rate. I think this is the main reason why many under age 50 consider COVID-19 not much more than a bad cold (at least as reported in the popular media).
There are case reports in the media as well as medical literature showing young healthy athletic individuals dying from COVID-19. The current data shows that this is a rare outcome from getting COVID-19 infection for those under the age of 50 and should not be considered an example of how virulent this virus is in that age group or even other age groups.
So how many people test positive for the Coronovirus of those who are tested
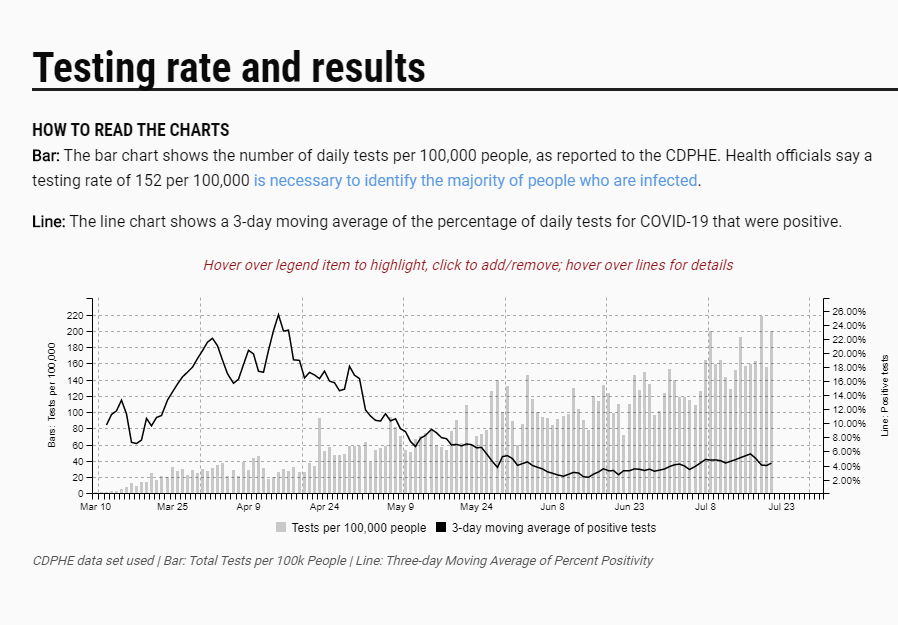
This graph is most interesting. It shows the percentage of those being tested at all testing sites (labs, drive by testing, and in office testing) who test positive.
Interestingly only 4-6% of those presenting themselves for testing actually test positive. The currently available nasal swab tests are actually very accurate at detecting the virus, so this information is very informative. Most of us who think we have COVID-19, actually do not have it.
This information tells me that most of the illness out there is still not COVID-19 but instead the usual seasonal viral and bacterial illnesses.
So how do I interpret and respond to this information as of this date
- This virus is a real threat to those over age 50 and certainly over age 60 in Colorado and globally.
- It appears that most of the new diagnoses in the United States are in individuals under the age of 50, who are less likely to need hospitalization and less likely to die from the illness.
- Most people who think they have COVID-19 don’t have it.
What are the practical implications going forward?
The SARS-CoV-2 virus is certainly out there and needs to be addressed on an individual basis, particularly for those over the age of 50.
How do you address it? 1. Face mask use in public places and with individuals whose quarantine practices are unknown or questionable. 2. Sanitize your hands after touching any public surface, like door knobs, counter tops, bathroom fixtures, etc. 3. Don’t touch your face or nose until you have sanitized your hands after contact in public environments. 4. Maintain a 6 foot distance when conversing or interacting with someone else whose quarantine and social distancing precautions are unknown.
All evidence supports the benefit of wearing masks and social distancing.
Current evidence supports that the vast majority of those getting ill after the reopening of businesses are those under the age of 50. The major concern is that not that those people will die from the illness, but that they will be contagious to those at higher risk of developing the severe complications of COVID-19.
For those in my practice we have the current protocol in place:
- If you become ill, call and convey your symptoms.
- If there is a shred of concern about COVID-19, we want you tested. We used to ask folks to come by, and we would meet you in the parking lot and do a nasal swab test. Unfortunately the time to get a test result back through my office is now up to 10-14 days. As of today we will refer you to a UC Health facility for testing. (This information is relevant as of today. I don’t actually know which facilities provide this service, so you will have to consult the internet to see which one is the closest and provides nasal swab testing. They claim to provide test results within 72 hours of testing.)
- Regardless where you get tested, we will follow you daily to decide if you need antibiotics and steroids. (This treatment has been shown to reduce your need for hospitalization by about 50%.)
These are points that deserve emphasizing
- Face mask use, social distancing, and good hand sanitation DO REDUCE the spread of COVID-19. I hate to be redundant, but these basic practices needs to be hammered into place for all of us.
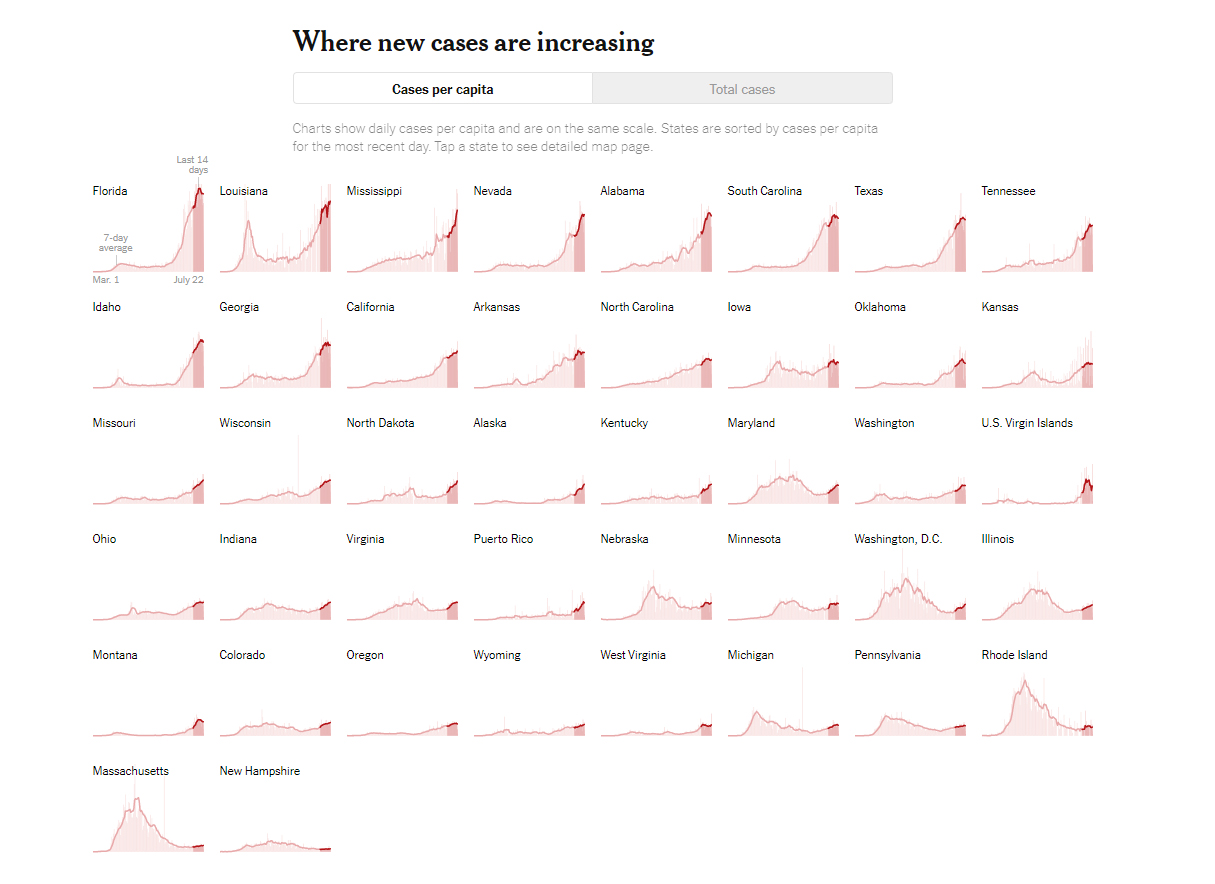
- Although the graph (from the New York Times on July 23, 2020) below may be hard to see, it shows that Florida, Alabama, South Carolina, and Texas show a change in their curve of new cases once they re-instituted more stringent social distancing and mask mandates after re-opening in an indiscriminate manner. These states were slow to institute personal protection measures initially and quick to open up their businesses with little to no restrictions. Although I don’t see Arizona on this graph, I have seen a similar graph showing a reduction in new cases once personal protection measures were re-instituted in the last several weeks.

- I don’t want to venture into the political arena, but there appears to be a correlation in states whose governors were more dismissive of the impact of this epidemic experiencing a greater resurgence of cases upon “wide open” re-opening of businesses.
- The current nasal swab testing and antibody testing that are commonly available are basically yes-or-no tests. They only tell you yes-or-no whether you have the virus on the swab or not. The antibody tests tell you yes-or-no that you have antibodies to SARS-CoV2 or not (with some caveats discussed below).
- The nasal swab tests DO NOT tell you how much virus is in your nose or throat nor do the antibody tests tell you whether you have enough antibodies to now be immune to getting COVID-19 if re-exposed to the virus.
- The current nasal swab tests DO NOT tell whether you have enough virus in your nose to get ill or be contagious. In several studies 30% of people with the virus detectable in their nose never got ill. Contact studies with those individuals show that those with a positive nasal swab, but who never become ill, are not very contagious and still appear vulnerable to getting ill if exposed to a large amount of virus at a later date.
- If you test is positive (unfortunately 3 days later to get the results), you will either be ill by the time the test results come back or not. If you are not ill within 3 days of a positive nasal swab test, you will likely not get ill. Studies from China have shown that those with positive nasal swab tests that do not become ill, clear the virus in 7 days from the back of their nose.
- So what about the antibody tests?
- We know that everyone with proven COVID-19 develops antibodies against the virus. EVERYONE, who has had COVID-19, test positive 3 weeks after the onset of their symptoms with the currently available antibody tests.
- The current antibody tests are great to prove that you have had a COVID-19 illness IF you have had an illness consistent with COVID-19.
- Unfortunately if you take 100 people who have had no illness whatsoever in the last 6 months, 7-8% of those people will test positive on the antibody test. That means that if you are well and have had no illness whatsoever, a positive antibody test is unfortunately a FALSE positive test. That result is a commonly known variance in biological testing called specificity and does not represent an actual measure of reality. That means that the test gave a completely erroneous result. You did not have the illness. Period. We have had several individuals who did not have an illness consistent with COVID-19 test positive initially, only to later test negative. This falls into the category of the first test being a FALSE POSITIVE test. They did not have COVID-19. The initial test was flat out wrong.
- The practical implication is that for those in my practice, regardless whether you had an illness in February that had all the symptoms of COVID-19 or no illness whatsoever in the last 6 months, I will want two positive tests before I believe you really had COVID-19. The likelihood of randomly having two false positive tests in a row is 0.49%. So if you have two positive tests, I will consider myself a believer that you have been exposed to COVID-19 and developed immunity against it. Short of two positive antibody tests I do not accept that you have been ill with COVID-19 and developed enough immunity to prevent a subsequent infection.
Dr. Gipson

I appreciated your interpretation of the graphics! Very interesting, Fran
Thank you!
Very well-done interpretation and analysis of our current Covid-19 virus outbreak in Colo.
Thank you!
I have heard on the news and seen in a few articles that increases in deaths seem to lag increases in infections by as much as 14 days. One source said that this phenomenon is attributable to the length of time it takes from a positive test for the illness to progress to the point of death. I have also read that the disease can progress very quickly from mild symptoms one day to hospitalization and death in a day or two. From the data you provide and the observation that the surge of infections is mainly among younger people, I’m wondering whether the lag between the surge in infections and the surge in deaths is due to the younger cohorts spreading the infection to older parents and grandparents in older, more death prone cohorts 60 and older. So 2 questions 1) is the 10 day to 2 week lag between surges in infection rates and death rates real, and 2) if so, is there a consensus among scientists as to an explanation?
1. There are several sources of lag in the this system and disease.
a) There is always a log in reporting, since the tests take days to finalized and the death count takes time to get off the death certificates.
b) It is possible that some of the lag is due to time to spread to older individuals. However older individuals appear to generally be embracing social distancing and mask wearing more that the younger age groups, so although spread is possible, so far we are not seeing a major rise in cases in older individuals. (The last bit is a generalization as there are younger individuals who are as diligent as older individuals as well as older ones as cavalier as younger ones.)
c) Most people die 10-14 days after the onset of their symptoms. Dying quickly is very unusual.
2. With this disease, “older individuals” means those over age 60, who have a higher risk of getting the severe complications of the disease.
3. The marked rise in cases and the slower or even negative rise in deaths is again interpreted as increase in disease in younger people who do not need hospitalization and are less likely to die from it.
I hope this provides a useful response to your questions and statements.